Some of the features are described below. See Tips
and Tricks for more details.
Semantic Highlighting
Code is highlighted based on semantic properties such as singleton
variables, defining occurrence, …
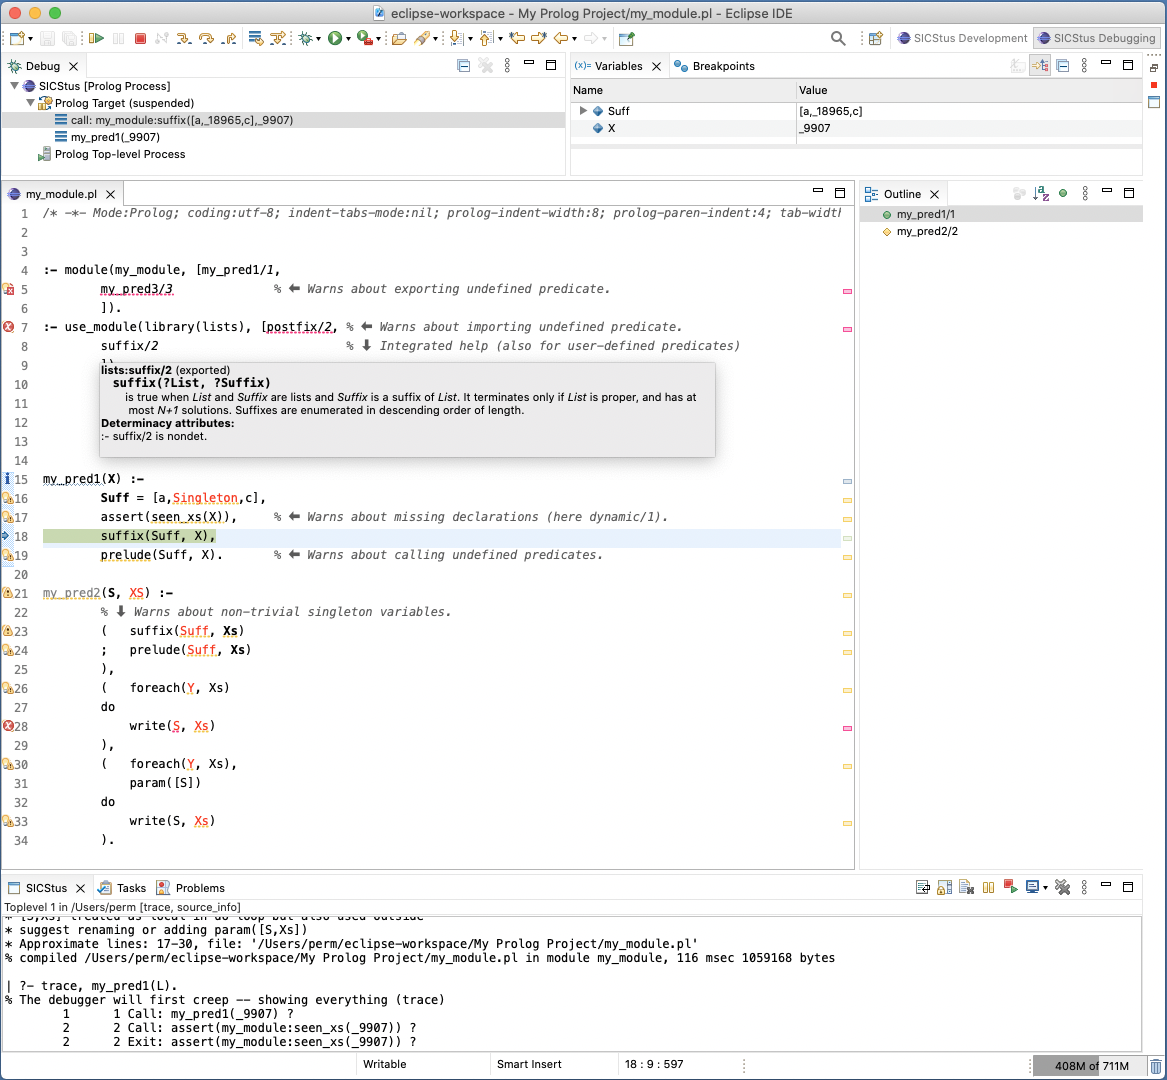
On the fly warnings
The editor flags things like calls to undefined predicates,
unreachable predicates, incorrect
use of predicates and directives, missing declarations, ….
Some warnings come with quick-fixes, i.e. automatic source-code modifications that fix the warned-about issue.
Problem markers are also enabled for Prolog code that is not open in
an editor.
Pop-up documentation
Predicate documentation is parsed on the fly and shown when the mouse is hovering
over a call. This works for both built-in and user-defined predicates.
Related information, like mode/1 and block/1
directives and various inferred information (determinacy, output
arguments) are also shown.
Open Definition
Click on a called predicate to bring up its source code.
It is also possible to manually enter the name of any predicate, with
completion, and go to its source code.
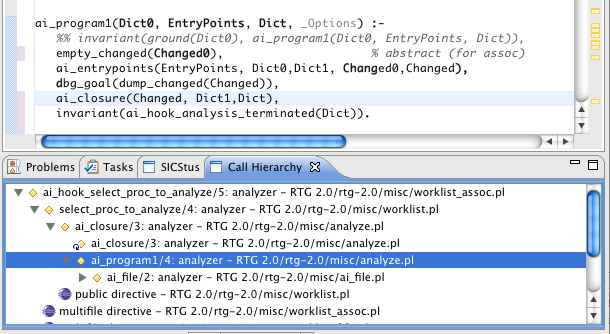
Call Hierarchy
Clicking on a predicate can bring up a tree of its callers and other
references.
A light-weight version of this command, that just opens the closest caller of the current predicate, is also available.
Determinacy Analyzer
Predicates are analyzed, on the fly, for potential non-determinacy or non-termination.
Mode Analyzer
Predicates are analyzed, on the fly, and likely output arguments are
shown when the mouse is hovering over the predicate in a goal.
Document outline
The predicates in a file are shown in an outline. They can be
alphabetically sorted and non-exported predicates can be hidden from
the outline.
Rename predicates and variables
Predicates can be accurately renamed in an entire project.
Variables can be renamed within a clause or directive.
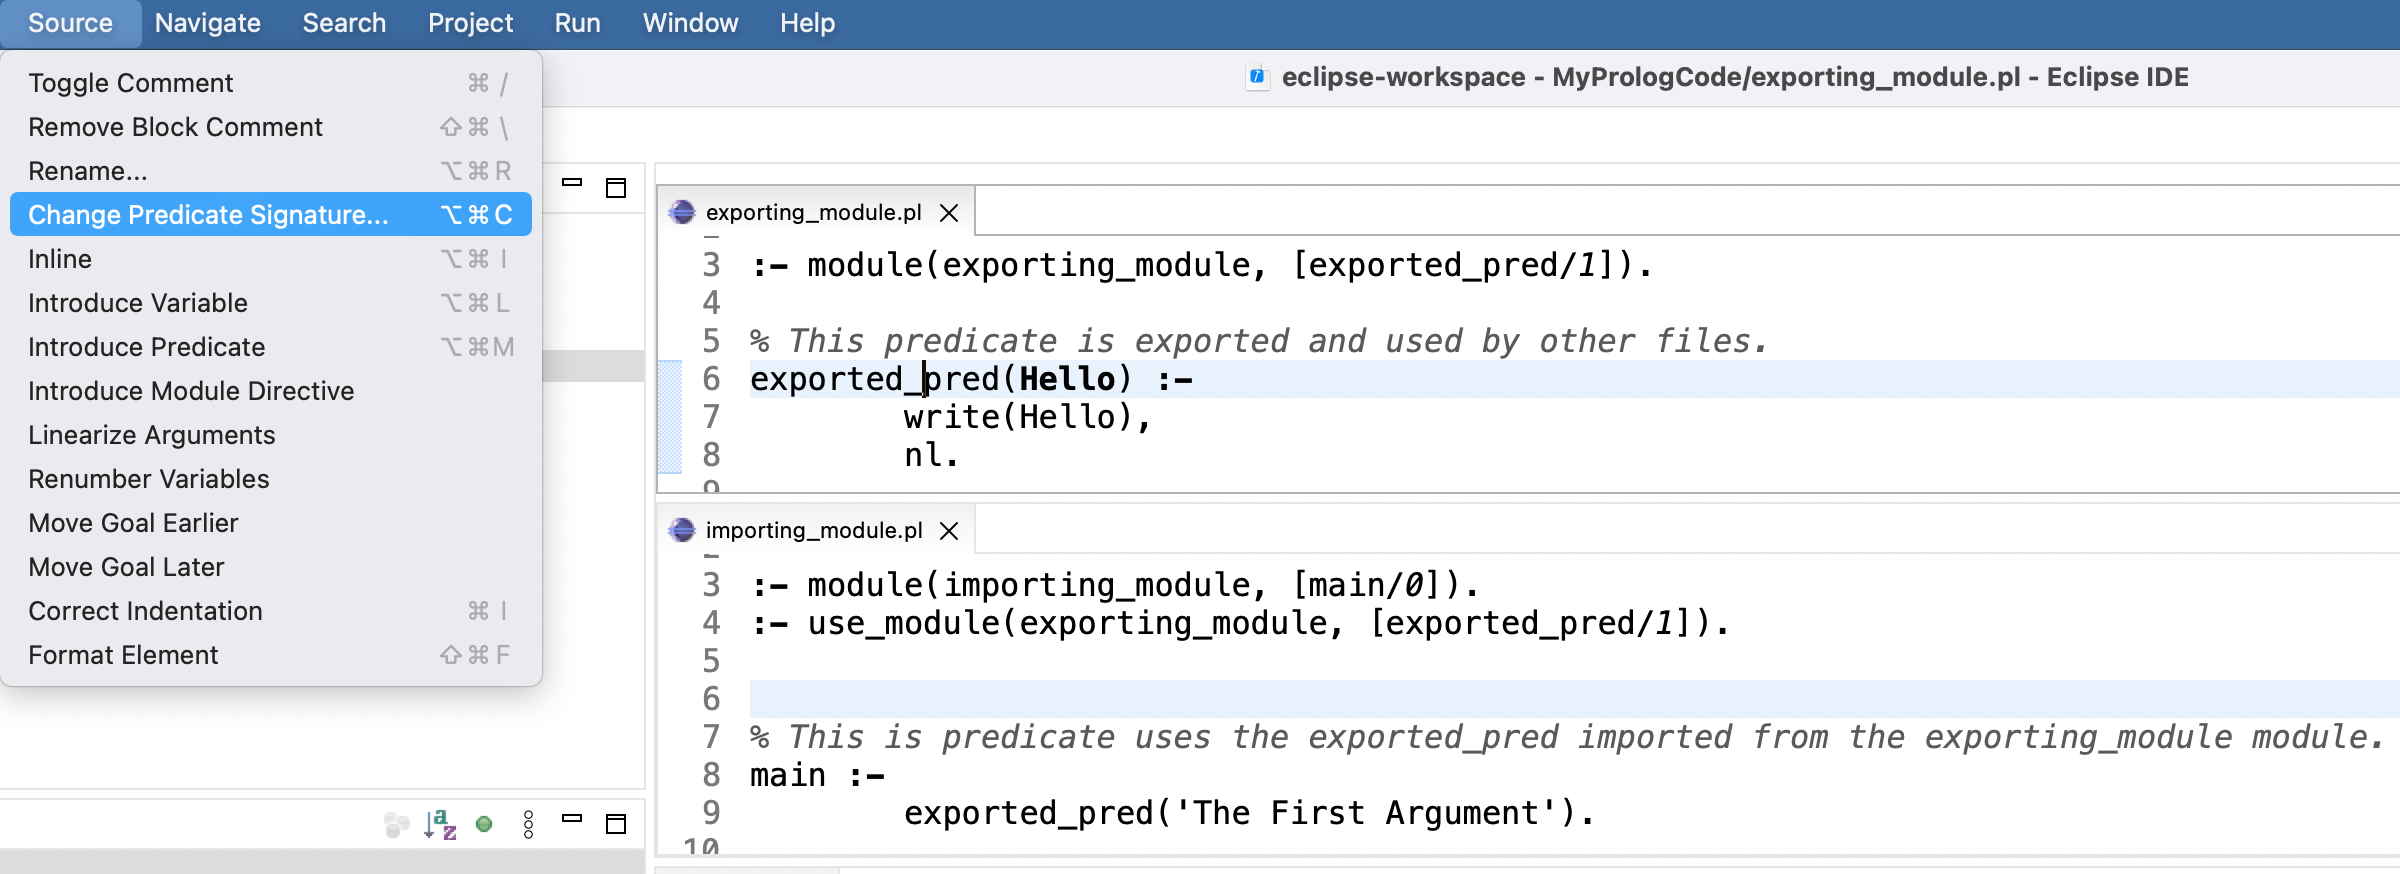
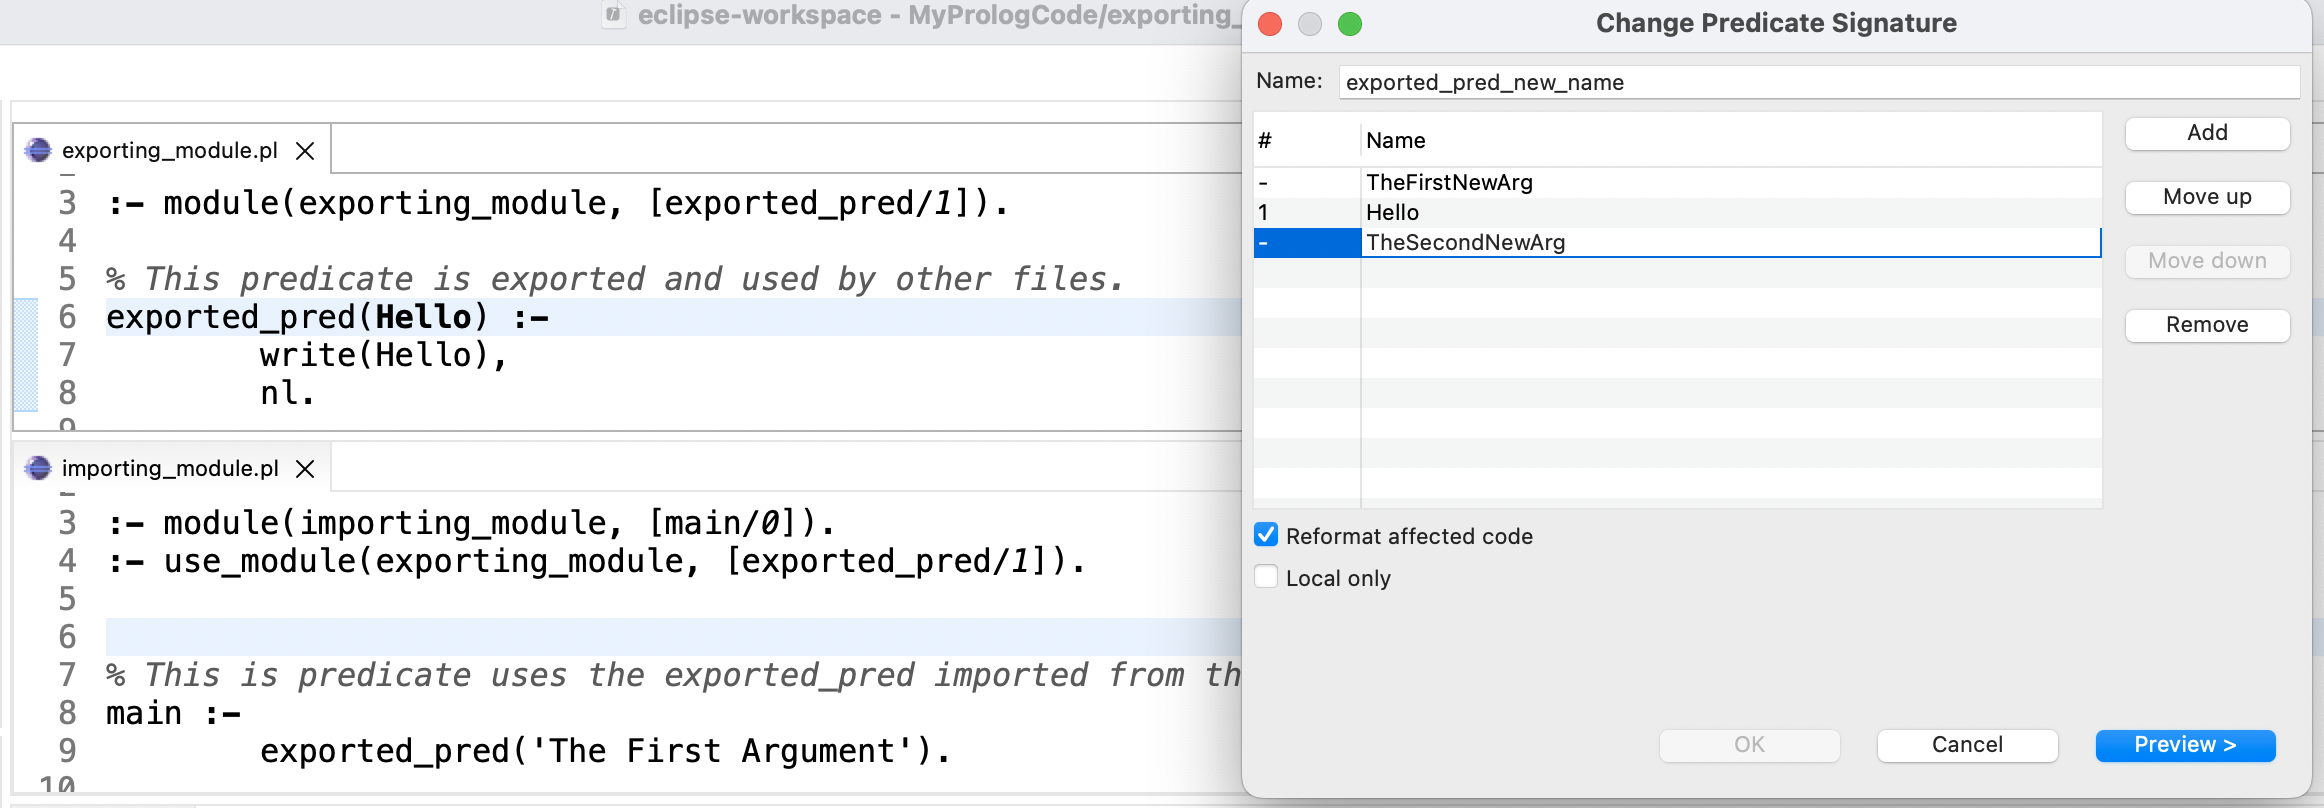
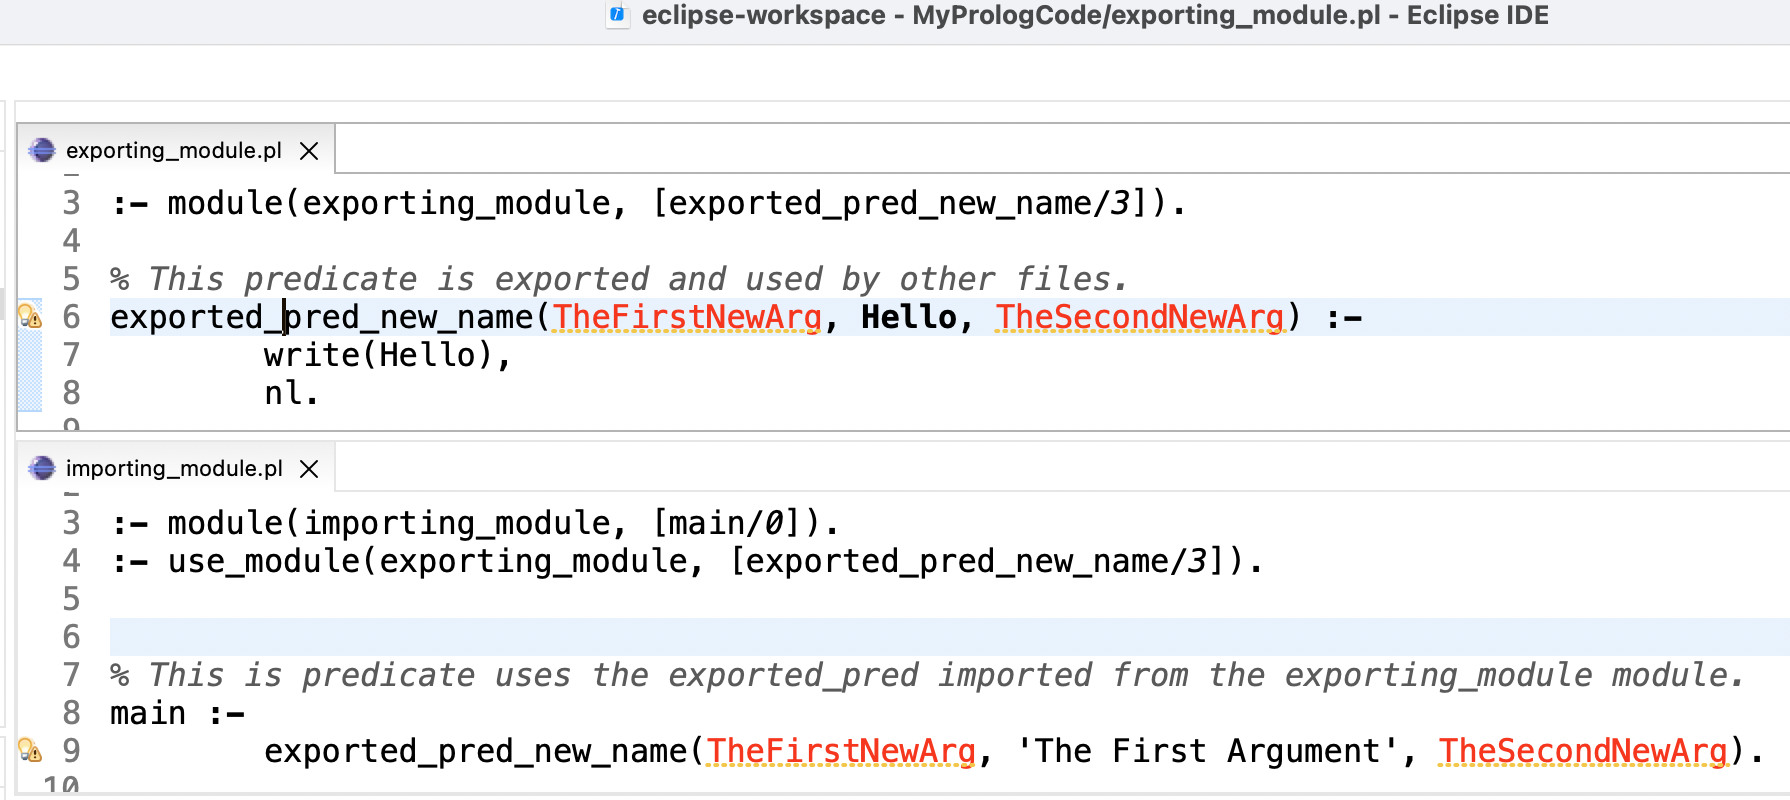
Change predicate signature
The number and order of arguments of a predicate can be changed, and
all referencing code will be updated in an entire project.
When adding new arguments, SPIDER warns that they must be assigned appropriate values.
Arguments can be added, removed, and rearranged
Existing argument position has been moved, added argument variables elicit warnings
Extract or inline predicate
Predicates can be created from selected code, and the code is
replaced with a call to the new predicate (“Extract
Predicate”). A call to a predicate can be inlined,
i.e. replaced with the corresponding clause body.
Extract or inline variables
Variables can be introduced from a selected term; variables can be inlined, i.e. replaced with their value.
Variable Bindings in Debugger
The debugger shows the names and values of variables.
Debugger Backtrace
Backtrace is shown and there are buttons for common debugger actions
(Step Over, Step Out, Redo, …).
Source Code Debugging
Source-linked debugging. This also works for code, like the SICStus library,
that has no recorded source info.
Breakpoints and Spypoints
Line Breakpoints and Spypoints can be added by clicking in the left margin of the editor window.
Prolog top level
The ordinary top level is still available, with input history and completion. This
includes the traditional debugger interface.
You can have multiple SICStus processes running, each in its own
top level view.
Profiling
The Profile view shows profile information
for code run with profiling enabled.
Coverage
The Coverage view view and editor margin
annotation shows source code coverage information for code run with
profiling enabled. This feature requires SICStus 4.2 or later.
Documentation
Integrated SICStus Manual and other documentation.