|
|
WELCOME TO SICStus Prolog Leading Prolog Technology |
| SICStus Home > The Spider IDE > Getting Started | Download for Evaluation |
|
|
WELCOME TO SICStus Prolog Leading Prolog Technology |
| SICStus Home > The Spider IDE > Getting Started | Download for Evaluation |
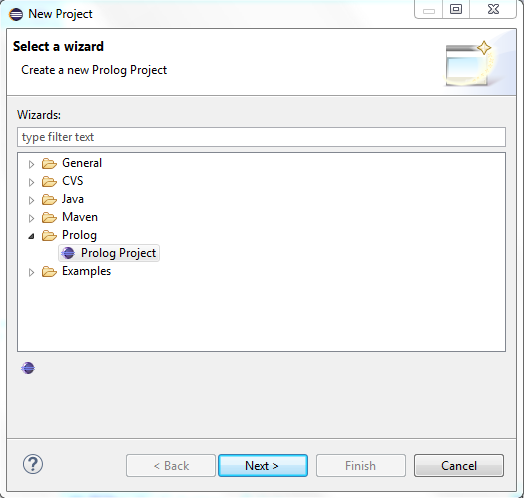
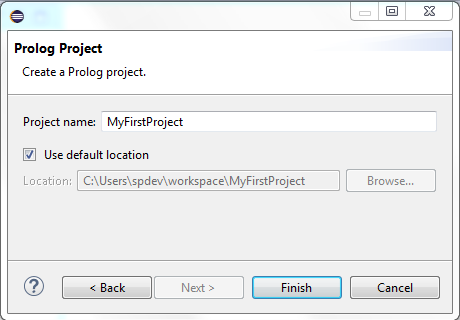
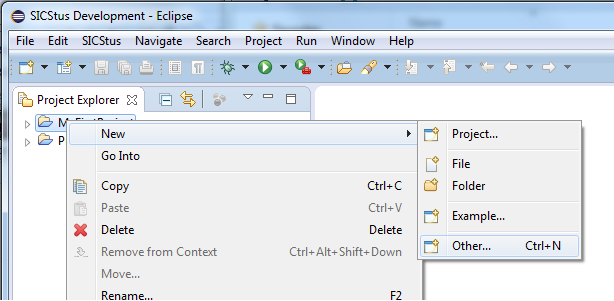
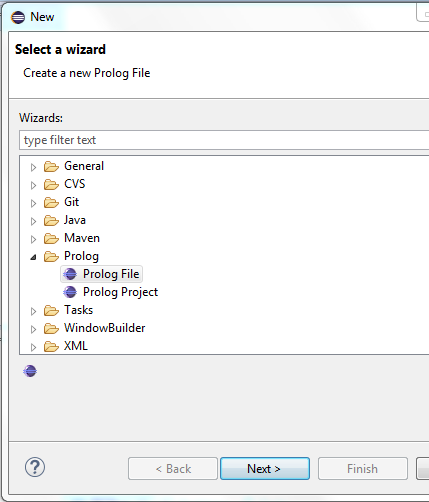
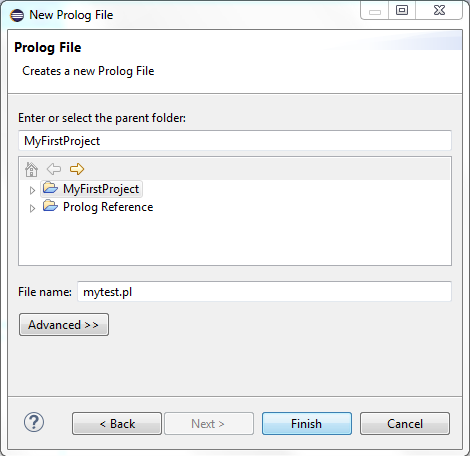
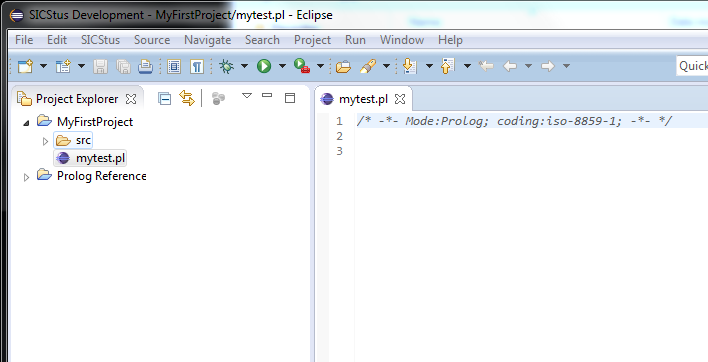
SPIDER Getting StartedSPIDER is the SICStus Prolog IDE, based on Eclipse. The following assumes that you have already installed SPIDER. The screenshots below are mostly from Eclipse 4.4 on Windows 7, neither of which is supported anymore, but both SICStus and Eclipse looks almost the same in newer versions and on other platforms, such as Linux and macOS, and the same or similar steps should be performed on all platforms. Full-size versions of the screenshots will open in a separate window when the thumbnail is clicked. Hello WorldTo work with your Prolog code you should create a Prolog project that refers to all your Prolog files. It is possible to refer to pre-existing folders, see below, but the following example will create everything from scratch. The following steps will create a Prolog project containing a single Prolog file.
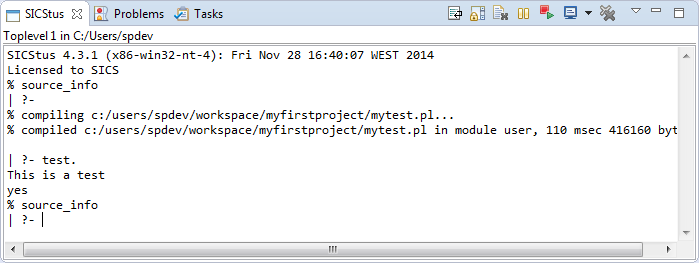
Start the SICStus Top LevelTo start the SICStus top level you need to bring the SICStus top level view to the front. You can do this with Open Top level from the SICStus menu. SICStus will, by default, start automatically but you can force SICStus to start, or restart, by pressing the “Restart Prolog” button. 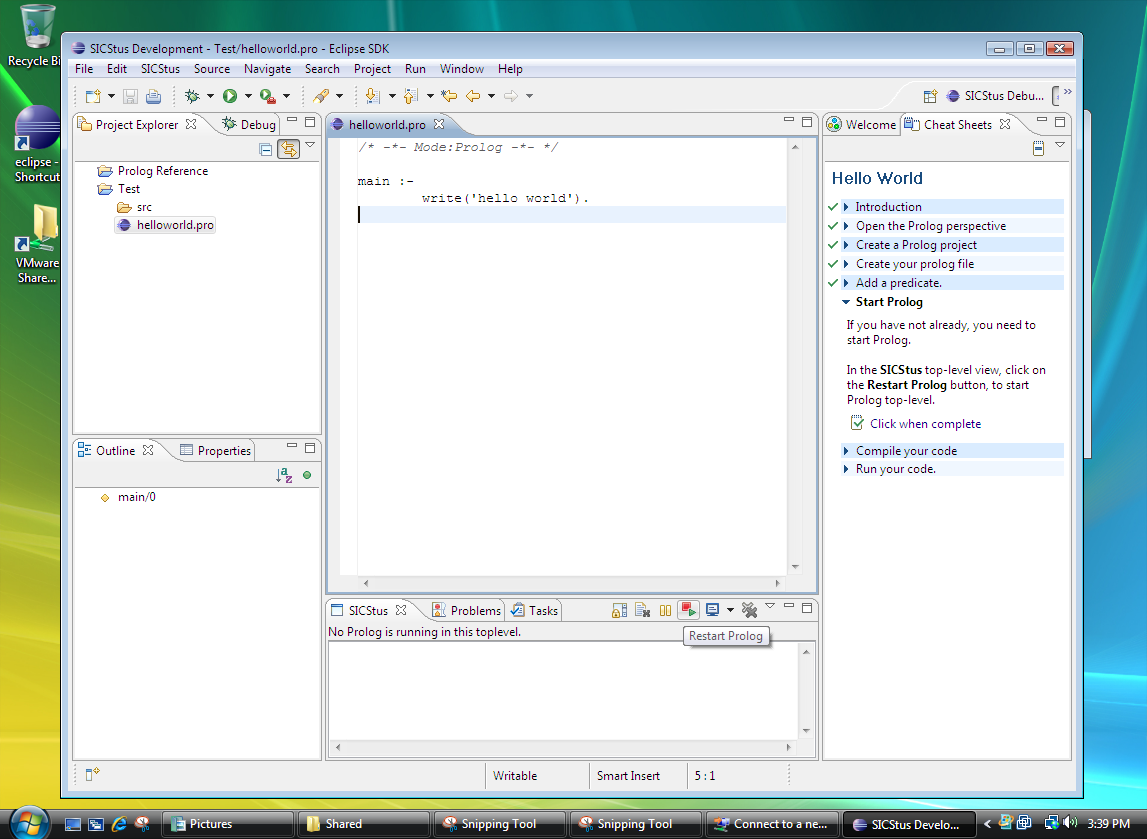 SICStus runs within Eclipse and interacts via the SICStus top level view. Some special commands are available by using the buttons at the top-right of the view. There is an interrupt button (with a “Pause” icon) as well as a command history mechanism. There is also a small icon that brings up a menu with additional commands, e.g. to change the working directory in the SICStus process. There is a, currently invisible, divide between the input area at the bottom of the SICStus view and the output area. The output area is read-only, you can only enter new text in the input area. 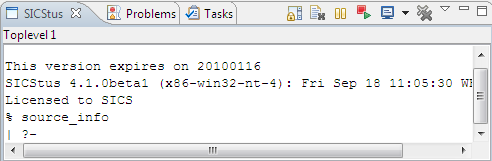
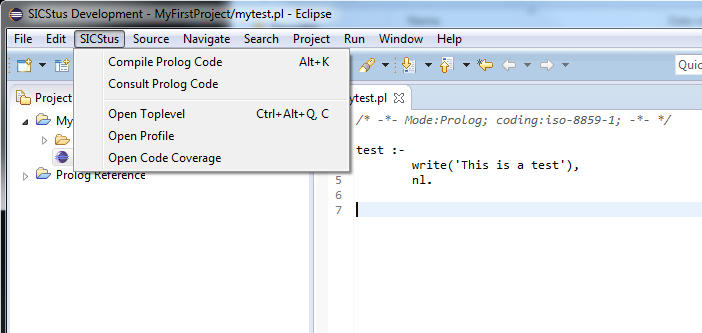
Compile your Prolog CodeYou compile (or consult) your code from the pop-up menu you can access by right-clicking on a Prolog file (either in an editor or from the Project Explorer). You can also do this from the SICStus menu.
Of course, it is also possible to call 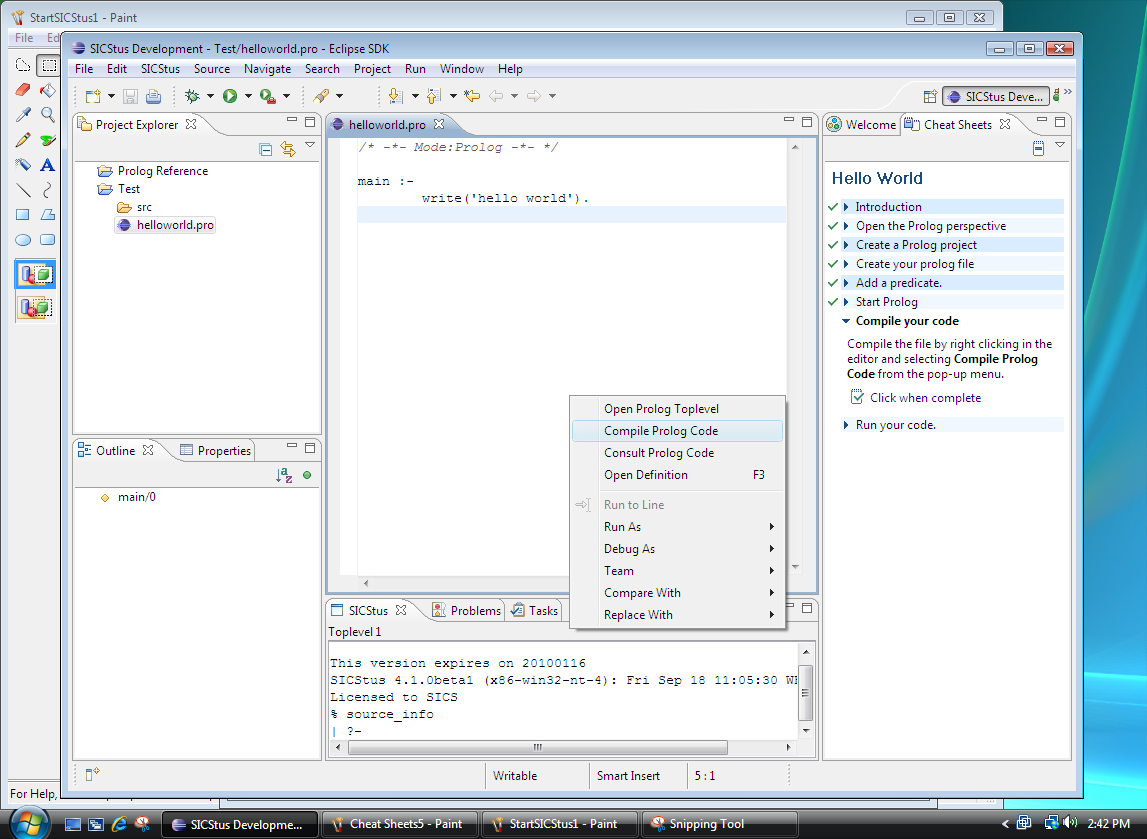 Run your Prolog CodeYou run your code from the SICStus top level, as usual. 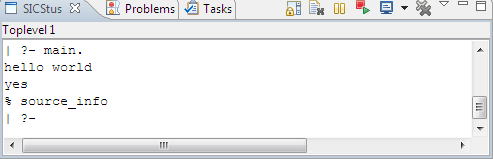 Work With Existing Prolog CodeIf you have existing Prolog code in some folder you can add a “link” to the existing external folder to allow Eclipse to work with the Prolog files in that folder without moving the folder contents. 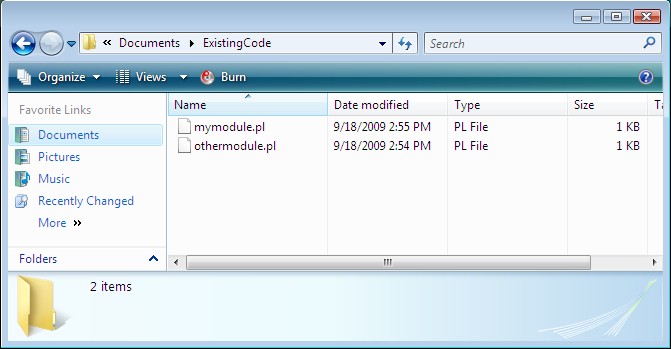 First, select (or create) a Prolog project and a folder within that project where you would like the link to the external folder to appear. Then choose New Folder from the File menu.  In the New Folder dialog, the Advanced button will allow you to create the folder as a link to your existing folder. It is a good idea to restart Eclipse after you have added all the needed links. 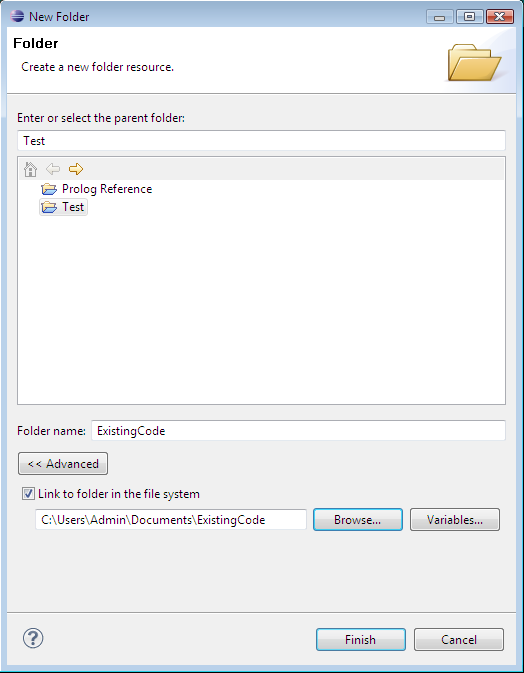 Work With the Debugger
You enable the debugger using the When you then enter the Prolog debugger Eclipse will ask whether you want to switch to the SICStus Debug perspective, a perspective optimized for debugging. You should let Eclipse switch perspective. You can switch between perspectives using the Window menu or by using the perspective buttons in the upper right corner of the Eclipse Window. 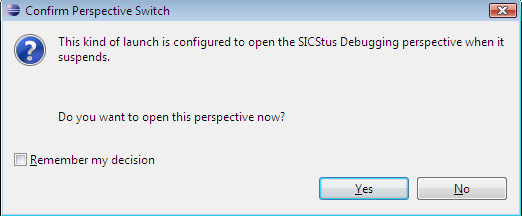 The SICStus Debug perspective shows the Debug view in the upper right-hand corner. Its buttons correspond to variants of common Prolog debugger commands. The Breakpoints view shows breakpoints. You can set spypoints and line breakpoints by double clicking in the left margin in a Prolog editor window (setting a breakpoint at the first line of a predicate will create a spypoint, and other lines will create a line breakpoint). The Variables view shows bindings for variables at the current debugger location. 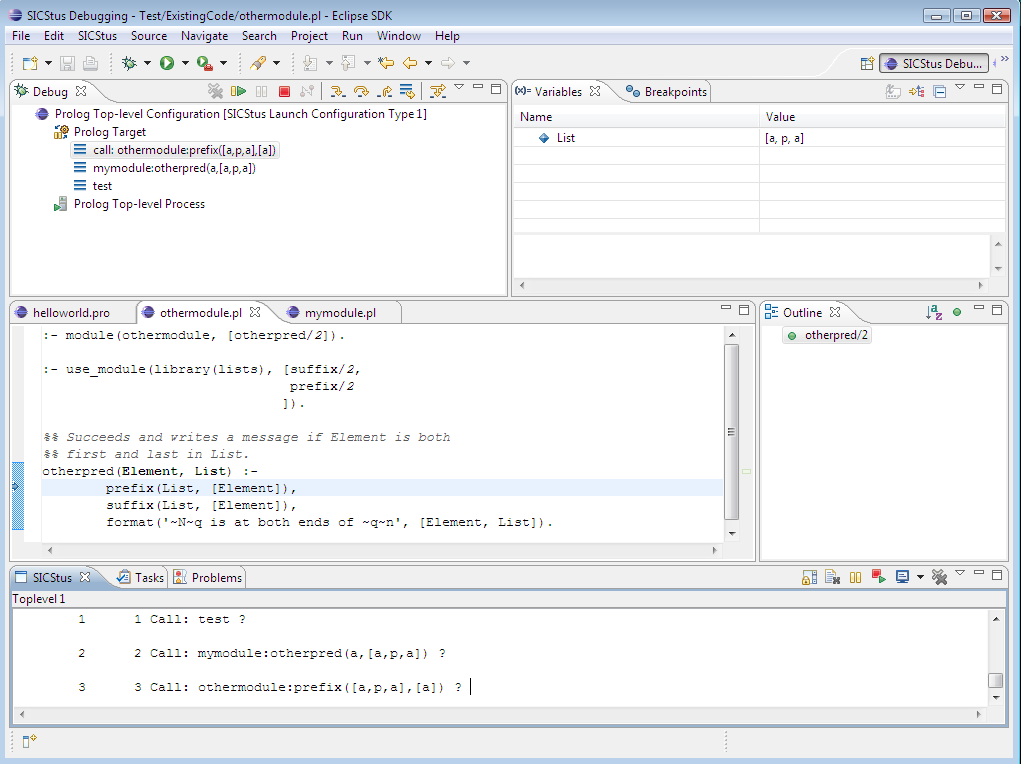 Some Eclipse TerminologyIn Eclipse, a Project is a collection of related files and folders that “belong” together, e.g. share the same settings and are compiled together. SPIDER will analyze all Prolog code in all Prolog projects and use the gathered information for things like completions and code analysis. Prolog code that is not located in a Prolog project can be opened but many of the more advanced features will not work. Another important Eclipse concept is Perspective. A perspective is a layout of views and menus designed for a particular kind of task. SPIDER has two perspective “SICStus Development”, which is the default, for writing Prolog code, and “SICStus Debugging” for using the Prolog debugger. Eclipse will automatically ask you whether you want to switch perspective. If you want you can modify a perspective by changing the layout and by adding or removing views. You can also manually open a Perspective from the Windows menu. |