The profiling and coverage information can be presented
in SPIDER, using the Profile and Coverage
views available from the SICStus menu.
The following steps should be taken to collect and present
the profiling and source code coverage information.
Compile, or consult, your code with source info enabled. Source
info is enabled by default when running SICStus in SPIDER. Source
info can be enabled with set_prolog_flag(source_info, on)
and disabled with set_prolog_flag(source_info, off).
Run your code with profiling enabled. It may be a good idea to
turn off profiling when uninteresting code is run. A typical way to
profile a goal bench(10) would be to
use set_prolog_flag(profiling, on), bench(10),
set_prolog_flag(profiling, off).
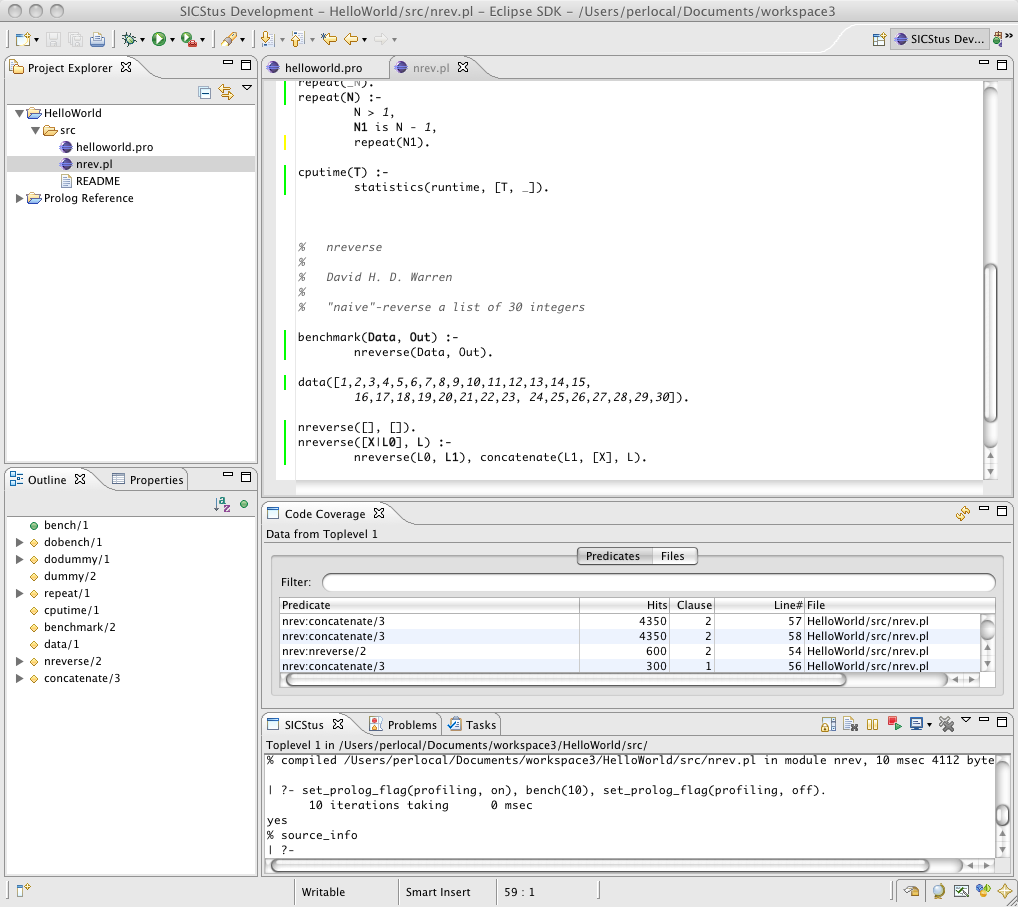
Open the Profile view, or the Code Coverage view, from the SICStus
menu. You can move these views around if you want to see them both
and prevent them from obscuring the Prolog top level.
You can refresh the views, using the refresh button, if you want
them to present new profile/coverage information.
It is also possible to export the data and to import previously saved profiling information.
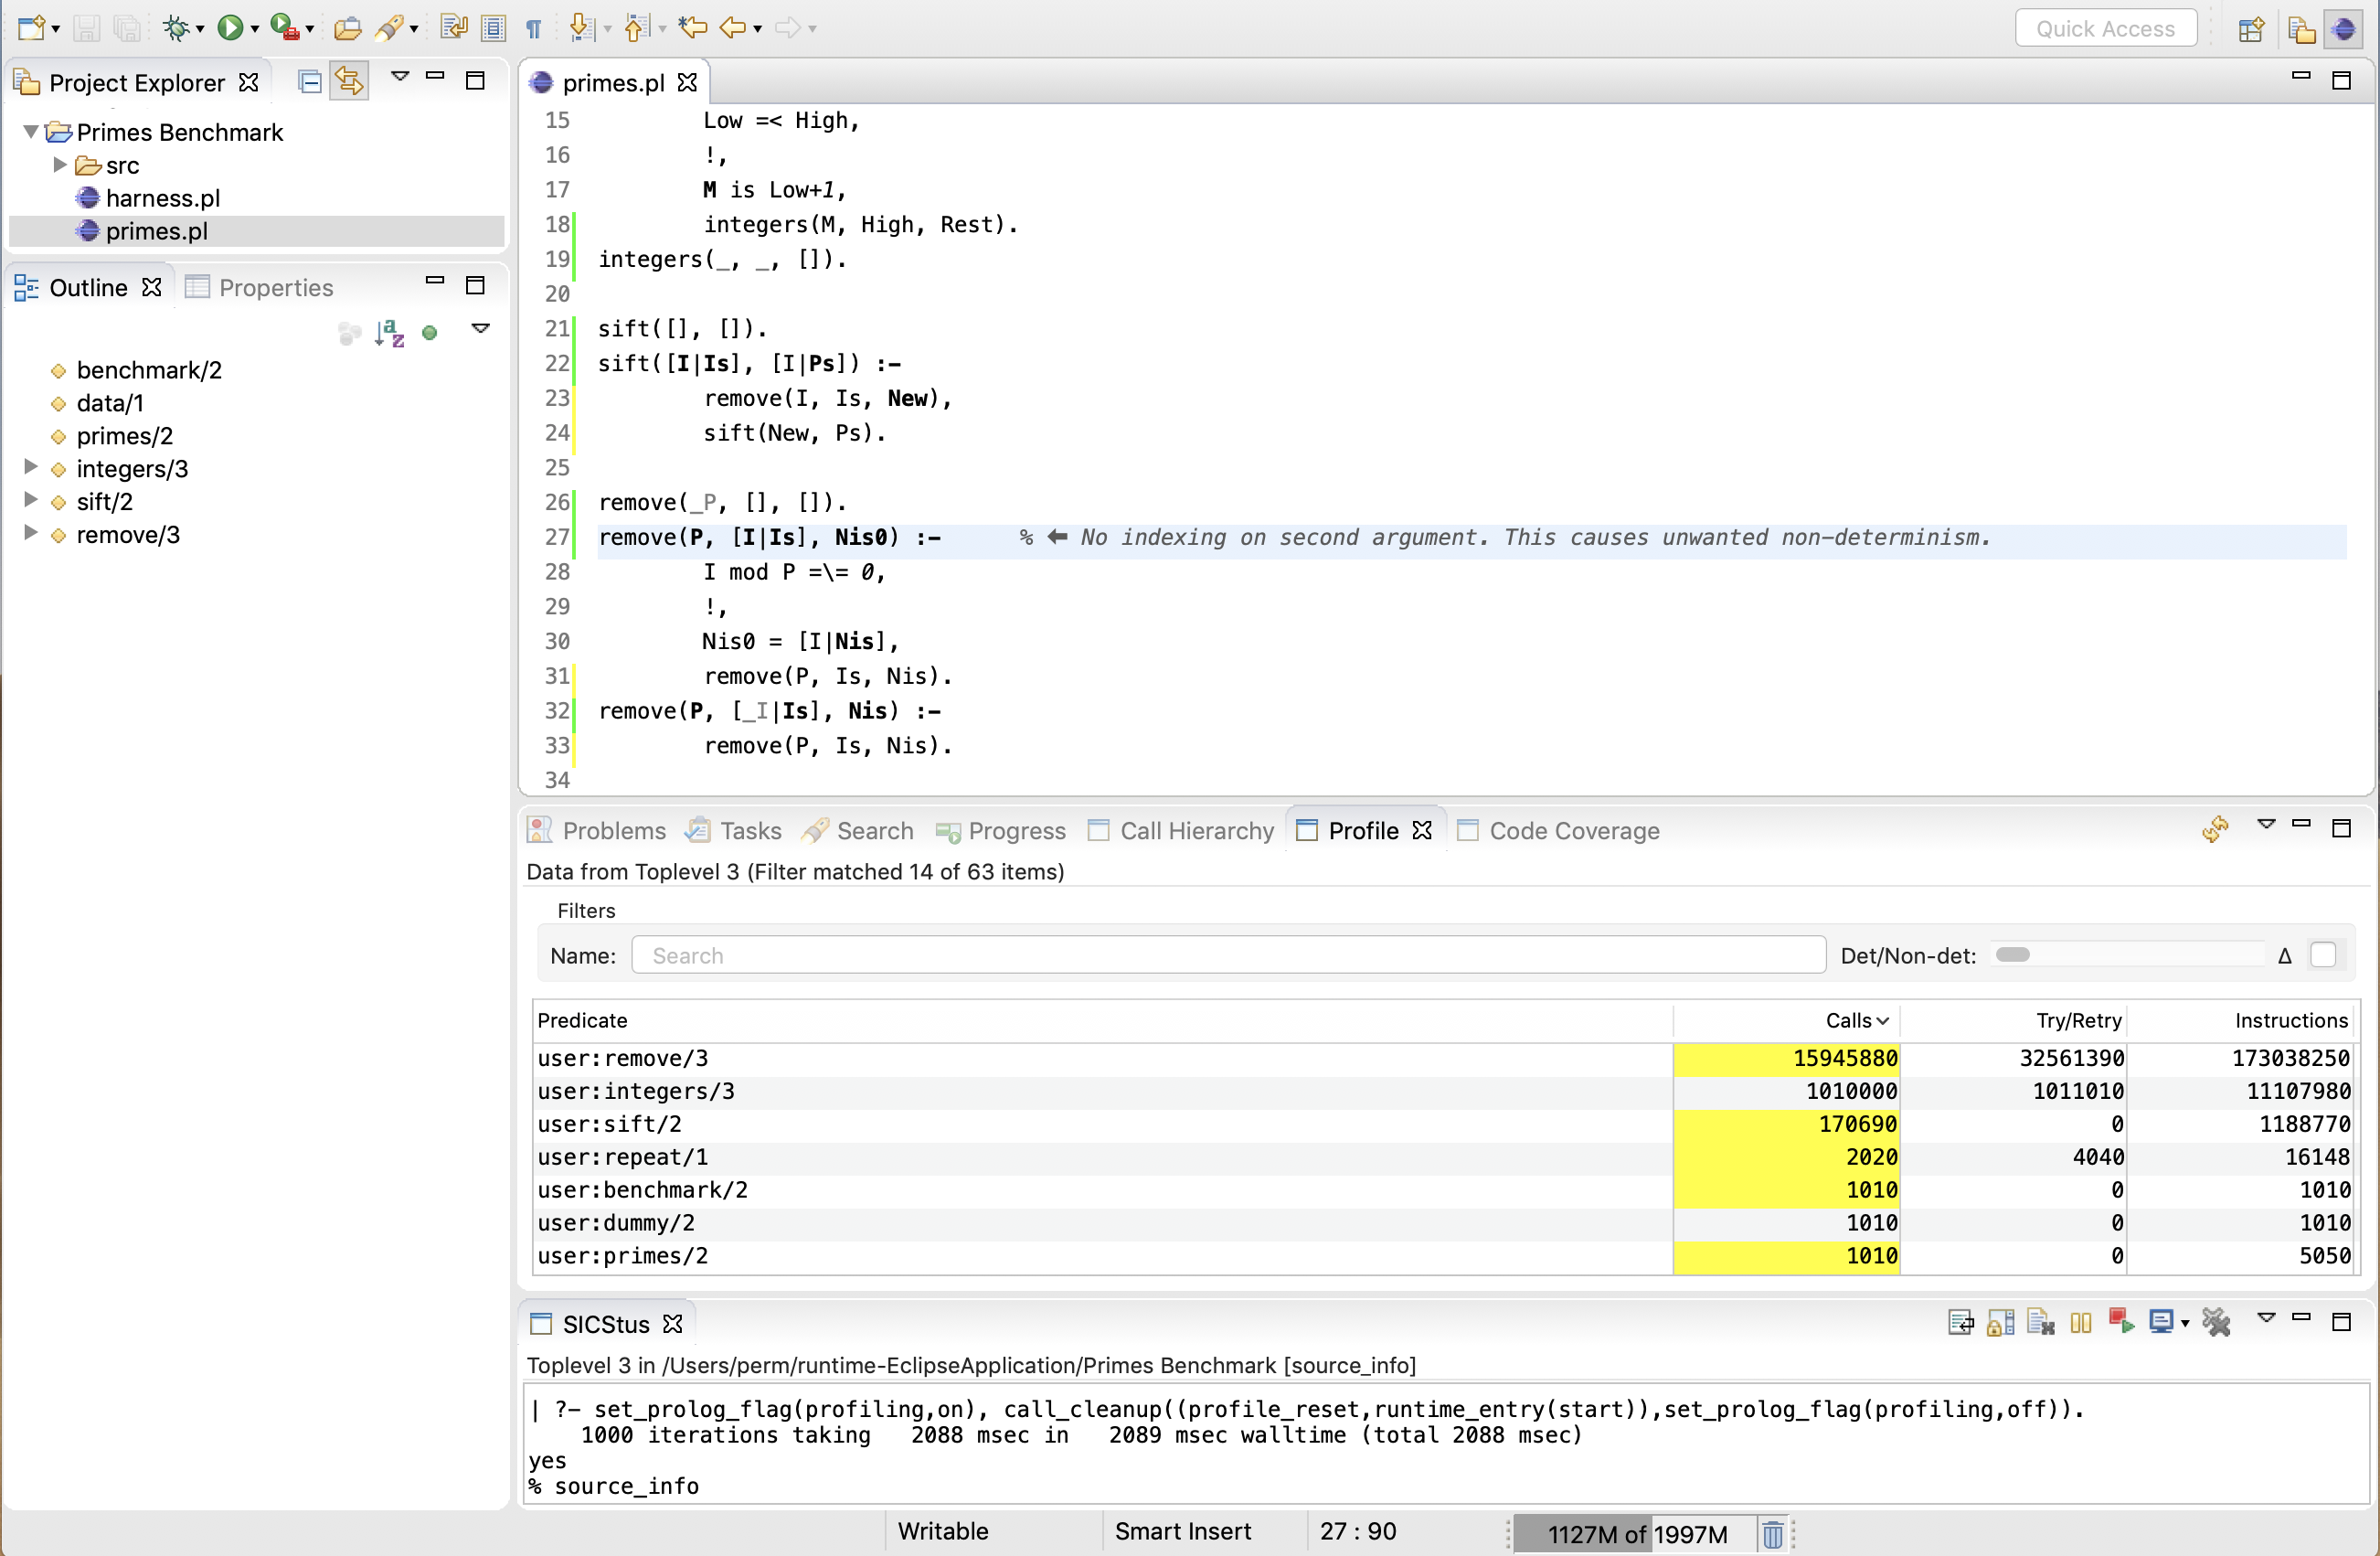
The Profile view offers ways to focus on the more interesting parts of the profile
Scope (available from the view menu). By default, only non-SICStus code ("My Code Only") is shown.
A determinacy filter, in the form of a slider. It will try to
focus on the causes of unwanted non-determinism. Moving the slider
farther to the right will more aggressively filter away
predicates while trying to retain the true causes of unwanted
non-determinism.
The determinacy filtering uses various, undocumented,
heuristics. One way to declare that a predicate foo/1 is expected to exit non-determinately is to add a directive :- foo/1 is nondet. in the same file as foo/1.