Next: lib-heaps, Previous: lib-file_systems, Up: The Prolog Library [Contents][Index]
library(gauge)The Gauge library package is a graphical interface to the SICStus
built-in predicates profile_data/1 and
profile_reset/0. See Execution Profiling for more information about
execution profiling. The interface is based on Tcl/Tk
(see lib-tcltk).
The SICStus IDE (see SPIDER) can also show profiling information. This makes the Gauge library largely obsolescent.
view since release 4.2Creates a graphical user interface for viewing the profile data accumulated so far. When the display first comes up it is blank except for the control panel. A screen shot is shown below.
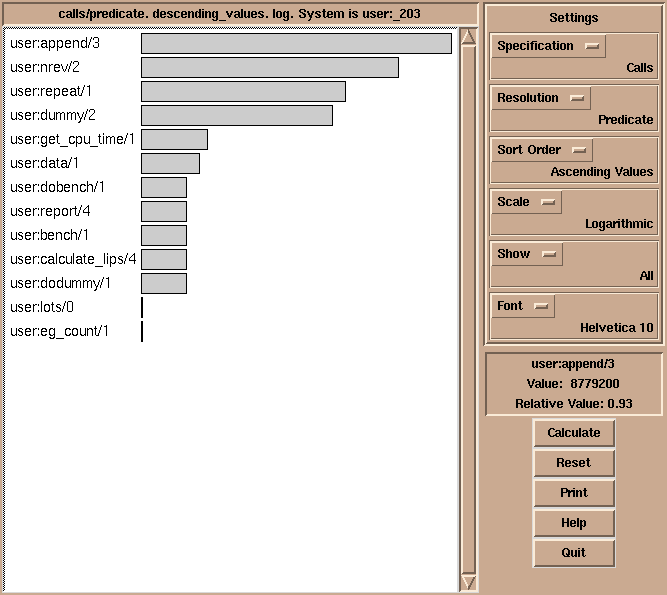
The menus and buttons on the control panel are used as follows:
Selects what statistics to display. One of:
The number of times a predicate was called.
The number of abstract instructions executed, plus two times the number of choice point accesses.
Number of choicepoints accessed (saved or restored).
Selects the sort order of the histogram. One of:
Sort the bars in alphabetic order.
Sort the bars by descending values.
Sort the bars by ascending values.
Show just the 40 highest values in descending order.
Controls the scaling of the bars. One of:
Display values with a linear scale.
Display values with a logarithmic scale.
Controls whether to show bars with zero counts. One of:
Show all values in the histogram.
Show only non-zero values.
The font used in the histogram chart.
Calculates the values according to the current settings. The values are displayed in a histogram.
The execution counters of the selected predicates and clauses are reset.
A choice of printing the histogram on a Postscript printer, or to a file.
Shows a help text.
Quits Gauge and closes its windows.
By clicking on the bars of the histogram, the figures are displayed in the Value Info window.