Node:Gauge,
Next:Chars I/O,
Previous:Tcl/Tk,
Up:Top
The Gauge Profiling Tool
The Gauge library package is a graphical interface to the SICStus
built-in predicates profile_data/4 and
profile_reset/1. See Profiling, for more information about
execution profiling. The interface is based on Tcl/Tk
(see Tcl/Tk).
To use the Gauge package, enter the query:
| ?- use_module(library(gauge)).
view(:Spec)
-
Creates a graphical user interface for viewing the profile data for the
predicates covered by the generalized predicate spec
Spec. For example, the call view([user:_,m2:_]), will
bring up the graphical user interface on the predicates contained
in the modules user and m2. When the display first
comes up it is blank except for the control panel. A screen shot is
shown below.
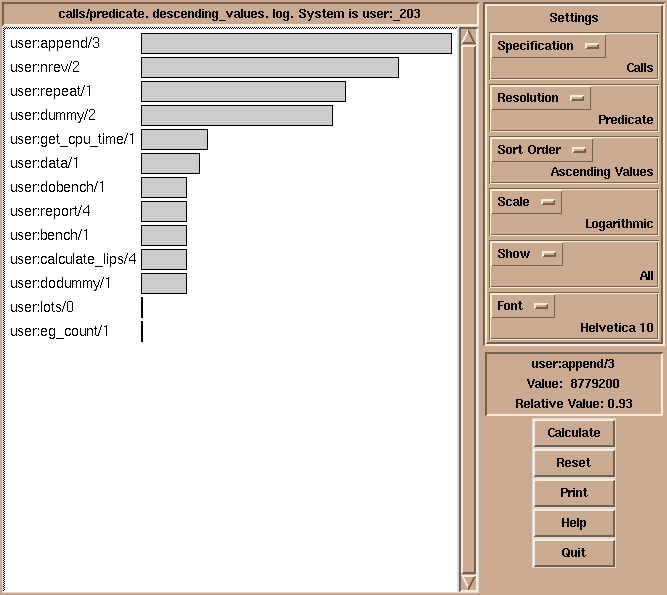
Gauge graphical user interface
The menus and buttons on the control panel are used as follows:
- Specification
- Selects what statistics to display. One of:
- Calls
- The number of times a predicate/clause was called.
- Execution Time
- The execution time. Beware, this is a synthetic value.
- Choicepoints
- Number of choicepoints created.
- Shallow Failures
- Number of failures in the "if" part of if-then-else statements, or in
the "guard" part of guarded clauses.
- Deep Failures
- Number of failures that don't count as shallow.
- Backtracking
- Number of times a clause was backtracked into.
- Calls+Backtracking
-
The number of times a predicate/clause was called or
backtracked into. This is particularly useful with clause level
resolution.
- Resolution
- Selects the level of resolution. One of:
- Predicate
- Compute results on a per predicate basis.
- Clause
- Compute results on a per clause basis, not counting
disjunctions and similar control structures as full
predicates.
- User+System Clauses
- Compute results on a per clause basis, counting disjunctions
and similar control structures as full predicates.
- Sort Order
- Selects the sort order of the histogram. One of:
- Alphabetic
- Sort the bars in alphabetic order.
- Descending values
- Sort the bars by descending values.
- Ascending values
- Sort the bars by ascending values.
- Top 40
- Show just the 40 highest values in descending order.
- Scale
- Controls the scaling of the bars. One of:
- Linear
- Display values with a linear scale.
- Logarithmic
- Display values with a logarithmic scale.
- Show
- Controls whether to show bars with zero counts. One of:
- All
- Show all values in the histogram.
- No zero values
- Show only non-zero values.
- Font
- The font used in the histogram chart.
- Calculate
- Calculates the values according to the current settings. The values are
displayed in a histogram.
- Reset
- The execution counters of the selected predicates and
clauses are reset.
- Print
- A choice of printing the histogram on a Postscript printer, or to a file.
- Help
- Shows a help text.
- Quit
- Quits Gauge and closes its windows.
By clicking on the bars of the histogram, the figures are displayed in
the Value Info window.